Showing posts with label Case Studies. Show all posts

Thursday, 24 May 2012

Case study of the management of a Tropical Storm in an LIC


I did this research a long time ago so data may be different to what you've collected, and I've tried to include as much detail as possible so you don't have to do extra research. It's all here.  You can now develop your own response for those hideous 9 mark questions that tend to ask about Case Studies. Hope this helps and if you have any comments, spot any errors etc, just let me know. :) 

Case study of the management of a Tropical Storm in an LIC: Bangladesh Cyclone, 1991

Prediction and monitoring
Bangladesh ranks as the world’s foremost disaster-prone country. Yet people cannot afford to live elsewhere as poverty is a huge issue and so they cannot leave the danger zone. The government does nt have the money to fund adequate disaster plans either. The frequent natural disasters in Bangladesh have a heavy toll on them as their economy cannot grow. Thus their technology is not as advanced as they cannot afford to do more scientific research on it. Their satellites and remote sensing technology is outdated and have been in existence since 1972. Meaning that by 1991 it would have been ineffective and less accurate. The Bangladesh Meteorological Department (BMD) are responsible for preparing weather forecasts, the data they received may have come late or were inaccurate thus they could not analyse it properly. This would affect when they warn citizens.  Also, because Bangladesh is an LIC, they cannot afford to send highly advanced, specially built planes up into the atmosphere through the cyclone to gather information on it, whereas the US can. If they do not know exactly how strong or how the cyclone is, they cannot be properly prepared for it.

Preparation for the cyclone hazard
The Storm Warning Centre (SWC) of the BMD provides forecasting and warnings. However, the warnings they sent out did not give people much time to react and prepare. Their megaphone warning system is ineffective, it involves people riding on bicycles between paddy fields and yelling out warning through their megaphones. This means the warnings do not reach everybody, and most people only had a few hours of warning and didn’t know where to go for shelter. Due to the lack of cyclone shelters (raised, reinforced concrete shelters) and safe places to go, people stayed at their poorly constructed house which are unable to withstand strong winds. (It was mostly flat land anyway, where would they go? The embankments were also ineffective against the storm surge.) Their houses were so weak that there was no point in boarding anything up. The lack of transportation also meant that people could not leave the danger zone and find a safe place. Some refused to evacuate thinking that the storm would not be as bad as forecasted. The citizens were uneducated in this respect, not knowing the effects of a cyclone and they were also unaware of the storm surge that would follow. This was what caused the most damage (90%), not the high speed winds. Without a proper evacuation plan, everything was chaotic so people were not prepared for the cyclone. Due to poor education and information available, citizens were unsure how to prepare themselves and react to the situation leading to more deaths. In the year 1991, these poor people had no hand phones, television or radios so they could not access information or keep updated. Few of them were in urban areas, in the rural areas there was no electricity to power these appliances anyway. The government did not prepare emergency supplies of food and water, this led to starvation and diseases.

Short-term response after the cyclone (e.g. disaster relief, emergency aid)
Training for disaster relief, emergency aid and local rescue workers was not thorough. The inexperienced workers were momentarily dazed by the disaster and were not prepared. Their slow reaction meant that many more people were injured and killed. Their equipment would not be as abundant and useful like in HICs such as USA, because that requires money. Due to a lack of transport, local rescue workers could not reach some stricken areas. Important things like band-aids and medical supplies ran out fast because they are expensive. With so many people needing help, there were simply not enough supplies to aid everybody. Simultaneously, the government failed to provide sufficient cyclone shelters for everybody affected. Thus the number of homeless people increased. Emergency electricity supplies and telephone links failed to work. Due to hundreds of acres of farmland and crops destroyed, there was insufficient food and a shortage of clean water—leading to further deaths from starvation and disease. With little help from richer countries, Bangladesh had to face huge costs they could not sustain, and people were left homeless and unemployed. American soldiers returning from war were redirected to Bangladesh and they save thousands of people. The government provided seeds for farmers to replant their crops.

Long-term response after the cyclone (e.g. improving prediction, making  adjustments to the previous preparation plan, redesigning buildings etc.)
Bangladesh looked to strengthen their cyclone warning system and make sure everybody is informed next time. Now they use television, radio, megaphones, house-to-house visits and other ways to inform people. Now, Bangladesh uses much more modern technology to predict the path of the cyclone. Recent statistical methods have been introduced for the forecasting of cyclone paths. Before they only used old subjective methods based on synoptic maps. Now SPARRSO (Bangladesh Space Research and Remote Sensing Organisation) has installed a model named TYAN to predict the track of a cyclone based on climatology of Bay of Bengal Cyclones for the last 100 years. The model has shown promising results for the forecast of cyclone movement, some 24 hours ahead of landfall—giving more time to announce the cyclone’s coming and allow people to evacuate and prepare. Many strongly built houses have been constructed high above sea level to serve as shelters for people in low-lying areas in the coastal region. Trees have been planted along the coastal area to help absorb some impact from the storm surge. A Flood Action Plan has been developed in case of emergencies. Now, each rescue worker team has basic warning equipment: handheld sirens, megaphones, signal lights, first aid kit and a transistor radio. School teachers, social workers and other people have raincoats, life jackets, torch lights and other equipment to help them in dangerous situations. But they do have other priorities as Bangladesh is still an LIC, so not that much has changed. However, the government is still more experienced and knowledgeable now.

Monday, 30 April 2012

UK Water Demand & Supply Case Study


Somebody asked for this, but it's not the case study I'm doing so this is just me copying what's in my book, it's all I've got since I know nothing about this.. :S Hope it helps anyway. 
I'll add some posts about water supply and demand that hopefully you can apply to this case study. :) 

Meeting the rising demand for water in England and Wales
Daily water consumption in England and Wales is about 120 litres per person per day. This is not a particularly high figure compared to 309 litres for France and 185 litres for Germany.

Water consumption in Britain has been rising along with the growth of population.
However, over the last 200 years, it has been given a number of pushes.
  1. The growth in manufacturing in the early 19th century. With deindustrialization in the second half of the 20th century, manufacturing uses less water (now 14%). Other consumers now account for more water use. Most notable is the use of water in the generation of electricity. More water is being used today to irrigate crops (14%) to feed a growing population and British citizens are using more water in their homes (20%). More homes today have washing machines, dishwashers and swimming pools.

Water is important in making electricity in two ways:
·   It is used to turn the turbines that generate the electricity, as in HEP (hydroelectric power).
·   It is converted into steam by the burning of fossil fuels and the steam turns the turbines.


The problem that faces England and Wales is that the distribution pattern of water demand is different from that of water supply (Figure 1.27). The highest water demand is in SE England which happens to be the driest part of the country. Water is most readily available (the rainfall is highest) in upland areas that are mainly located in Wales and the north of England. The mismatch between demand and supply creates different levels of water stress (Figure 1.28). Clearly the greatest water stress lies in the south-east of England. It is being tackled as follows:
·         Extracting as much water as possible from the aquifers of SE England
·         Constructing reservoirs in the north and west of the country to collect as much rainfall as possible. Famous reservoir schemes include Lake Vyrnwy in Wales and Kielder in NE England
·         Transferring this collected water by pipeline to the main reas of water deficit, i.e. the major cities of the Midlands and South
There is no doubt that meeting the rising demand for water is a challenge for the UK. Attempts are being made to reduce water consumption by encouraging a much more efficient use of the available water and to eliminate water wastage.


Saturday, 14 April 2012

The Three Gorges Dam, Yangtze River, China


In the IGCSE Geography Specification, you're meant to know a case study for a dam or reservoir project, and I learnt this, so...: 

Case Study of a Dam or Reservoir Project: The Three Gorges Dam, Yangtze River, China (multi-purpose scheme)
Yangtze River: Intro Facts
·         Source=Himalayas, flows into the East China Sea at Shanghai
·         3rd longest river in the world
·         Floods regularly, unpredictable, prone to severe flooding (every 10 years on average)
·         Last great flood-1998, an area the size of New Zealand was flooded
·         US$30 billion worth of damage
·         In the 20th century, over 300,000 people have been killed by the Yangtze floods

The Three Gorges Dam: A multi-purpose scheme
Main purpose: to prevent flooding downstream
Other uses:
·         Generates HEP (hydro-electric power)
·         Provides water to urban areas and to agriculture (irrigation)
·         Will improve river transport upstream

Cost-Benefit Analysis of the Three Gorges Dam

Benefits/Advantages/Positive Effects (in order of importance according to me)
1.       Control flooding downstream of the dam.
2.       Provides water to urban areas and for agriculture-irrigation. (The reservoir can store up to 5 trillion gallons of water.
3.       The HEP generated will provide 15% of China’s electricity demand.
a.       This will decrease China’s dependency on coal and therefore reduce greenhouse gas emission.
4.       Thousands of construction jobs were created during the building of the dam.
5.       China will be able to bring 10,000 ton ocean going vessels all the way inland, 2000km up to the city of Chongqing.
6.       The dam will become a tourist attraction and will attract a lot of people to the area. Many tertiary sector/service jobs will be created.
7.       The electricity generated will help the economic development of cities such as Chongqing, population=3 million.

Costs/Disadvantages/Negative Effects (in order of importance according to me)
1.       Several large towns upstream, such as Fuling (population=80,000) and Wanxian (population=140,000) will be flooded.
a.       Ancient temples, burial grounds and other historic sites will be lost beneath the reservoir too.
2.       Over 1.3 million people will have to be relocated.
3.       Much of the land used for resettlement is over 800m above sea level, where the climate is colder and the soil can barely support farming.
4.       The pressure created by the huge weight of the water in the reservoir behind the dam could trigger earthquakes. (But it is engineered to withstand an earthquake of 7.0 on the Richter scale.)
5.       The untreated human and industrial waste will not be washed away downstream, but will stay and pollute the river instead.
6.       Areas downstream will be deprived of fertile sediment.
7.       It will divert money from other developments. It is currently one of the most expensive projects in the world, costing more than $26 billion, over their budget.


Thursday, 5 April 2012

Kobe Earthquake, 1995


Based on my own research, some data could be different to what you find.. 

Case Study of the Management of a Tectonic Event in an HIC: Kobe Earthquake, 1995


Intro facts: Cause of the earthquake:
  • The earthquake was caused by the Philippines Plate being subducted under the Eurasian Plate.
  • The focus was very shallow; it was only about 15km.
  • The epicentre was very close to Kobe, around 20km away.

Intro facts: Short term impacts of the earthquake
  • Nearly 200,000 buildings were destroyed.
  • A 1km stretch of the elevated Hanshin Expressway collapsed.
  • 120 of the 150 quays in the port of Kobe were destroyed.
  • Electricity, gas and water supplies were disrupted.
  • Fires caused by broken pipes and ruptured electricity lines, swept the city.
  • An estimated 230,000 people were made homeless.
  • The number of deaths was put officially at 5500.
  • At lest 40,000 people suffered serious injury.

How Was The Earthquake Disaster Managed?

Before the earthquake: Prediction
  • The Japanese government established the Imperial Earthquake Investigation Committee in 1892 in response to the Nobi earthquake (1891) which caused significant damage in Japan. However, they failed to predict the Great Hanshin Earthquake.
  • Even though Japan has one of the most advance Earthquake prediction systems, they failed to predict it. Kobe had not had a major earthquake for more than 400 years so there was less prediction equipment there than in other areas of Japan.
  • Although people on duty could see that there were many tremors (prior to the earthquake), they did not raise the alarm. It could be that they were getting complacent because they had not received a huge earthquake for a long time.
Before the earthquake: Preparation 
-        Illusion of preparedness made people complacent-caught unaware.
-        There were still many old, traditional houses in Kobe. They had heavy tiles on the roofs to withstand typhoons; but they injured many people when the wood supporting the roof collapsed.
-        Most new buildings built had been designed to be earthquake proof; but because of liquefaction, they still toppled over. The houses were not retrofitted, resulting in many elderly people injured.  Transport infrastructure not retrofitted either.
-        They didn’t have sufficient emergency supplies. Especially water-couldn’t fight fire efficiently.
+        Schools and factories had regular earthquake drills.
After the earthquake: Response In The Short Term
·         They had to get clean, fresh water from other parts of the country.
·         The Japanese government evacuated people into temporary shelters because they still faced the dangers of fires and unstable buildings. The government was criticized for being so slow in mobilizing the army-sluggish response.
·         Bulldozers were brought in to clear fallen buildings.
·         The local fire department put out the fires.
·         Civilians helped to rescue others who were trapped.
·         Medical aid centres were set up.
After the earthquake: Response In The Medium & Long Term
  • By January 1999, 134,000 housing units had been constructed. All homes and buildings had to be built to strict regulations and they were made more earthquake resistant. (Flexible frames, steel support.)
  • Water, electricity, gas and telephone services were fully working by July 1995.
  • Within a year, 80% of the port was working but the Hanshin Expressway was still closed.
  • The railways were back in service by August 1995.
  • More instruments were installed in the area to monitor seismic activity.
  • Major transport routes were reinforced so they do not get destroyed or damaged in the event of another major earthquake.
  • Earthquake resistant shelters were constructed in local parks.
  • The city plan was more spaced out, buildings were further apart so that if one collapsed, it would not create a domino effect. Buildings were not allowed to be built on unstable land.
  • Developed more open space in the city so that people had a large area to evacuate to.
  • Japan refused international aid for a while then finally let them in.


Wednesday, 4 April 2012

Case Study of Impacts of a Tropical Storm in an HIC

Note: this is based on my own research and 'fact's are different from site to site..so it could be different from what you find! 
http://www.nhc.noaa.gov/1992andrew.html

What Are The Impacts Of A Tropical Storm In An HIC?
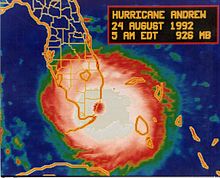
Case Study: Hurricane Andrew - Florida, USA (August 1992)

Fact File
Date: 24th August 1992
Category: 4
Ocean it formed in: Eastern Atlantic
Direction it came from: Travelled in West & Northwest direction- headed                               towards the Lesser Antilles
Name of a city affected: Florida
Wind speed: 240km/h (150 mph)
Storm surge: 5 metres

Effects
Deaths: 30
Injuries: hundreds seriously injured
Cost of damage: Total cost estimated over ₤50 billion, Insurance claims in excess of ₤12 billion
No. of homes destroyed: 25,000 homes destroyed, 100,000 badly damaged
Number of homeless: 175,000 in South Florida alone
Damage to transport infrastructure: 52 roads blocked, 9,500 traffic signals damaged
Electricity supplies: 5311 metres of power cables destroyed, 1.3 million homes and businesses left without power
Most damage caused by winds or storm surge: Winds
Environmental damage: Hundreds of hectares of forest flattened, 25,000 gallons of oil spilled into Biscayne Bay, 33% of coral reefs damaged at Biscayne National Park, Killed 7 million fish due to depleted oxygen in waterways, 8% of all Florida agriculture destroyed
Other effects: 82,000 businesses destroyed/closed down, 120,300 job losses


The Case Study of Impacts of a Tropical Storm in a LIC can be purchased by buying my full set of IGCSE Geo Notes. :) 
Contact: michelle.lim205@gmail.com

Sunday, 1 April 2012

Shanty Town Model Answer

For a named city in an LIC, explain the management strategies being used to minimise the problems of its shanty towns (squatter communities)                                                                                                         (9m)

This answer should get 8-9 marks, and is based on my own research and what I wrote in a unit test. Please refer to a previous post 'Shanty Towns' and 'Shanty Town Case Study: Sao Paulo's Favelas' for more information to help you develop your own answer. :) 

Name of city: Sao Paulo, Brazil

Sao Paulo has around 2500 favelas including Jaguare, Heliopolis and Paraisopolis. Many improvements have been made to these shanty towns. There are site-and-service schemes where government or non-governmental organisations (NGOs) provide building materials for the locals to build a better home on their land. Once built, city authorities would help install basic amenities like electricity, running water and sanitation. This reduces the number of people illegally hooking up to overhead electricity lines and improves health as people have access to clean water for cooking and washing. With sewage systems the chances of diseases spread is also minimised. There are microlending schemes where locals can apply for small loans to finance their businesses or to start a business. In Heliopolis a microcredit scheme was developed by a non-profit US organisation and the Brazilian government where locals with small businesses can apply for loans between $100-$1500. Tenure is used where help has been given to locals so they have legal rights over their homes and land, so they are more secure. In Jaguare for example, there is a strong neighbourhood association where people in the favela have worked together to persuade the government to reduce crime and offer people, especially children, a wide range of sport or other activities. They also helped provide better infrastrcuture with better roads, more recreational facilities, especially for children. There are charity projects so other wealthier people volunteer to teach the shanty locals basic hygiene. Through medical associations healthcare has also been made more accessible so there is more of a chance of diseases cured and longer life expectancy.Sao Paulo also has edge cities developing like Jardines which may encourage rural-urban migrants to live away from the main city, so there is less pressure in the shanty towns.

The full notes for Shanty Town Case Study: São Paulo Favelas is in my IGCSE Geo Notes Set which is up for sale! 
Contact: michelle.lim205@gmail.com

Monday, 12 March 2012

Case study of inner city redevelopment: London Docklands

You can refer to page 168-169 of Key Geography for GCSE textbook.

During 19th Century-port of London busiest in the world
Surrounding the docks were:
  • many industries using imported goods
  • high-density, poor quality housing (typical old inner-city area)
1950s-ships become bigger = unable to reach London's docks
By 1970s, area became derelict, with few jobs, few services and poor living conditions. 
Many people forced to leave area to look for work + better quality of life.
Because: 
  • traditional jobs in docks were lost (manual, unskilled, unreliable and poorly paid)
  • most housing was substandard-lacking basic amenities (services e.g. water, sewerage, electricity..) and located in poor-quality environment
When textbooks talk about amenities, they mean:
Amenities definition: A desirable or useful feature/facility of a building/place. e.g. basic services in housing like electricity, water, sewerage... 

In 1981, the London Docklands Development Corporation (LDDC) was set up to try to improve:
  • social
  • environmental
  • and economic conditions of the area
LDDC given 3 main tasks: 

1. Improve social conditions by:
  • creating new housing
  • creating new recreational facilities
  • improving shopping facilities
2. Improve economic conditions by:
  • creating new jobs
  • improving transport system (to and within area)
3. Improve environmental conditions by: 
  • reclaiming derelict land 
  • cleaning up docks
  • planting trees
  • creating areas of open space (people like parks and peaceful green surroundings)
To clarify if you're confused: 
Derelict land: land that is damaged or abandoned and cannot be put to use until damage is repaired 

Reclaiming derelict land is: to recover land that has lost its productivity and to make it usable again


What improvements were made after 1981?

Social Improvements


1. Housing

  • 22,000 new homes created (many are former warehouses converted to luxury flats)
  • 10,000 refurbished former terraced houses (Refurbish: to renovate and redecorate smth esp. a building
-In 1981 population= 40,000
-In 2000 population= 85,000

2. Services
  • several huge new shopping malls
  • post-16 college and campus for new University of East London
  • leisure facilities: watersports marina, national indoor sports centre 

Economic Improvements


1. Employment

  • number of jobs increased, In 1981= 27,000  In 2000= 90,000
  • many new firms and financial institutions e.g. Stock Exchange, ITV Studios, newspaper offices
  • many high-rise office blocks, esp. at Canary Wharf
2. Transport
  • Docklands Light Railway links area with central London
  • Jubilee Line Underground extension
  • City Airport
  • Many new roads, including M11 link 
Environmental Improvements
  • 750 hectares of derelict land reclaimed 
  • 200,000 trees planted
  • 130 hectares of open space created

However, remember that not everyone was happy about the changes, because not everybody benefited:


Negative effects on the local people: (in descending order of importance to me, others may be more important for you, but structure your answers in an exam so that you write what's most important first!)

  • new jobs went to people living outside the area, as local people did not have the technical skills (a lot of new jobs created were in finance/media industries--using high tech equipment--local people not skilled enough to do these types of jobs)
  • a lot of new housing far too expensive for locals
  • more money was spent on providing infrastructure (expensive offices + houses) and a clean environment for office workers; than on services (e.g. hospitals and care for elderly, health + educational facilities for local people)
  • noise + air pollution (dust) from the building
  • prices in area generally increased (e.g. in shops, bars etc.) --newcomers were wealthy, causing local shop and recreational prices to rise--
  • newcomers did not mix with local people--tension--causing a breakdown of East Ender's community

Thursday, 8 March 2012

Mississippi Flood Defence Scheme Case Study

An example of an exam question, and how to structure your answer because there is a lot of information. This is very full on and very long, in an exam, you may want to cut short your answer. But this has everything, is very detailed, so that you have an example of a complete answer. Make it your own words and make it more concise. That's your job now!

For a named flood defence scheme, describe and explain how it helps to reduce the flood risk. (9m)
Name of flood defence scheme: Mississippi River Flood Defence Scheme, USA

The Missouri River is a main tributary to the Mississippi River, 6 huge dams have been built on it, creating a 1600km chain of 105 reservoirs, controlling the amount of water added to the Mississippi River. Thus reducing the risk of flooding. The Tennessee is another major tributary, 9 dams have been built on its river such as Kentucky and Nick-a-Jack, and 10 have been built on its tributaries. The Tennessee Valley authorities (TVA) have also been responsbile for planting many trees. Afforestation has occurred in the upper Mississippi drainage basin system, delaying surface run-off by interception by vegetation. Trees also absorb water, their roots delay throughflow and run-off too. All this reduces the amount of water reaching the river and delays it as well. This gives the Mississippi more time to transport flood water away. The Bonnet Carré floodway has been constructed to divert excess water from the Mississippi. It begins 50km North of New Orleans and diverts excess water along a 9km spillway through 350 small bays to Lake Pontchartrain, and eventually into the Gulf of Mexico. The Mississippi River has been straightened and shortened. From 1934-1945, a 530km stretch of river has been shortened by almost 300km. It cuts through the meanders making it straighter and shorter. this increases the gradient and therefore the speed, so flood water can be transported away faster. Levées have been strengthened and heightened. Instead of soil covered by bundles of willow, which is very vulnerable to erosion, it is now reinforced concrete. A special barge backs away from the shore leaving 25m x 8m concrete mattresses. This is repeated until the deepest part of the bank is covered to above flood level. For example in St. Louis where the confluence of the Missouri and the Mississippi is, it has a levée made of reinforced concrete. It is 15.8m high. The flood level of 1993 was 15.05m. This levée protects St. Louis from the Mississippi flooding. 

An update:
To help you formulate your own answer, I thought this might help:

River management/Flood Defence scheme: Mississippi, USA (reduced flood risk)

1. Dams and reservoirs
The Missouri River (tributary): 
  • 6 huge dams built on it,
  • creating 1600km chain of 
  • 105 reservoirs that prevent flooding, provide water supply, and HEP.

-these dams reduce water reaching/added to the Mississippi, without them, 1993 flood would be even worse.

1b. Dams and reservoirs 2
The Tennessee River (tributary): 
  • Tennessee Valley Authorities (TVA) set up in 1930s have many functions, one of which is to control flooding of this river. 
  • 9 reservoirs on the main river (e.g. Kentucky, Nick-a-Jack, Wilson, Wheeler..)
  • 10 reservoirs on its tributariers
Dams hold back water in times of flood, and release it when river levels are lower. 
Success-1957, instead of river reaching dangerous peak of 16.5m, dams and reservoirs limited the level to harmless 9.8m. 

Note: The TVA is a multipurpose scheme which:
  • controls flooding
  • provides a water supply
  • produces hydro-electricity
  • improves navigation
  • increases afforestation
  • reduces soil erosion
  • encourages industry
  • encourages tourism

2. Afforestation 
TVA also responsible for planting many trees. Trees delay run-off and reduce amount of water reaching the river, as its roots absorb some. 

3. Diversionary Spillways
These are overflow channels-they take surplus water during times of flood.
The Bonnet Carré Floodway begins 50km north of New Orleans.
In times of flood, it diverts excess water away from the Mississippi through a 9km long spillway, through 350 small bays/reservoirs into Lake Pontchartrain, where the water eventually ends up in the Gulf of Mexico.
This has greatly reduced flood risk in New Orleans and Baton Rouge. 

4. Straightening and shortening course
By cutting through narrow necks of several large meanders. 
Between 1934 and 1945, a 530km stretch of river was shortened by almost 300km
By decreasing the distance, the gradient increases, hence the speed increases--so flood water is transported away quicker. 

5. Strengthening the levées
Levées used to be made of soil covered by bundles of willow-but this was prone to erosion.
Now, specially designed barges back away from shore laying concrete mattresses measuring 25m x 8m. The process is repeated until the bank is covered from the deepest point of the river to above the flood level. 
St. Louis levée is made of reinforced concrete (steel bars inside) 15.8m high (and 18km long) and protects St. Louis, because that is where the confluence of the Missouri and the Mississippi is. (1993 flood peak was 15.05m, but the levée withstood the water's weight.)